The data set is the three-dimensional crustal velocity model in Sichuan-Yunnan region obtained by applying the full-waveform adjoint tomography. First, the seismic waveform data is applied from National Earthquake Data Center. Using the collected seismic waveform data, we intercept the seismic phase data with high signal-to-noise ratio according to the seismic events, and extract the amplitude information after removing the mean and trend and filtering. Finally, the amplitude data are used to obtain the three-dimensional crustal velocity model in Sichuan-Yunnan region by applying the waveform adjoint tomography. The model can be used for further study on valuable scientific issues such as the mechanism of the preparation of large earthquakes and tectonic evolution of the lithosphere in Sichuan-Yunnan region and the eastward extrusion of the Tibetan Plateau.
YANG Dinghui

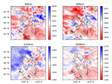
The data set is the three-dimensional upper mantle S-wave Q model in Sichuan-Yunnan region obtained by applying the full-waveform adjoint tomography. First, the seismic waveform data is applied from National Earthquake Data Center. Using the collected seismic waveform data, we intercept the S-wave seismic phase data with high signal-to-noise ratio according to the seismic events, and extract the S-wave amplitude information after removing the mean and trend and filtering. Finally, the S-wave amplitude data are used to obtain the three-dimensional S-wave attenuation model in Sichuan-Yunnan region by applying the waveform adjoint tomography. The model can be used for further study on valuable scientific issues such as the tectonic evolution of the lithosphere in Sichuan-Yunnan region and the eastward extrusion of the Tibetan Plateau.
YANG Dinghui

Through the joint inversion of seismic waveforms and InSAR coseismic displacement data, our study revealed the spatiotemporal and spatial source rupture processprocesses of the two strong earthquakes that occurred in struck the eastern Tibetan Plateau atin May 2021. The results show that the Yangbi earthquake, which occurred in along the southeastern margin of the TibetTibetan Plateau, was a Mw6.1 event with characterized by unilateral right-dextral strike-slip rupture and 8s an 8 s duration. The In addition, the Maduo earthquake, which occurred in the interior of the Tibetan Plateau, was a Mw7.5 event with characterized by left-sinistral lateral-strike- slip extendedextending along both sides of the earthquake seismogenic fault and 36sa 36 s duration. The rupture properties of these two strong earthquakes reflect the deformation characteristics of different parts of the eastern Tibetan Plateau,. and also These events also caused the increase of the Coulomb stress of the surrounding active faults to increase, so we should pay attention to the risk potential of future earthquakes should be evaluated.
WANG Weimin

This data set consists of multi-scale and high-resolution seismic wave velocity, attenuation, anisotropy, interface and stress field model of the crust, lithosphere and upper mantle beneath the Sichuan-Yunnan area. The velocity and attenuation models are mainly obtained by applying waveform adjoint tomography, double difference tomography and ambient noise tomography methods. The anisotropic models are mainly obtained by applying shear wave splitting, receiver functions and ambient noise methods. The interface structure is mainly obtained by receiver functions. The stress field model is mainly restrained by GPS velocity field and focal mechanism. Some of the used seismic waveform are from published data, and some are obtained from deployed seismic stations. The model data set can be used for further study on valuable scientific issues such as the mechanism of the occurrence of large earthquakes and the tectonic evolution of the lithosphere beneath the Chuandian Block, and the dynamic mechanism of the eastward extrusion of the Tibetan Plateau.
PEI Shunping
")
The data was collected in Qiangtang (2020.11-2020.12) and Altyn-Tagh (2021.11-2022.01). Four natural seismicity, six near-earthquakes and two teleseisms were recorded by 361 short-period seismometers from Nov. 2020 to Dec. 2020. And 315 short-period seismometers recorded five near-earthquakes and two teleseisms (including the mangya earthquake with m5.3 in Qinghai province on December 19, 2021) from November 11, 2021 to November 1, 2022. After data preprocessing (de-mean, de-linear trend and taper), we cut the events recorded by the seismometer with a fixed width of 1500s from the time of earthquake occurrence for each seismic event(i.e., the time range of each seismic event data is [begin, begin +1500s]). For the active source signals recorded, since the node instrument records continuous signals for a month, the signals recorded by each instrument are intercepted according to the initiation time and location, and the seismic records for 200s are intercepted from the initiation time. After time correction, data of each shot were de-mean, de-linear trend and taper.
LI Lun
")
Seismic observations can be used to constrain the seismic velocity structures and deformation patterns of the crust and upper mantle. The southeastern Iranian plateau is the transitional zone from subduction to collision. The study of this region can provide an important basis for understanding the dynamic progresses of the plate convergence and associated tectonic responses. The data comes from the portable seismic array deployed by this research group. The site selection requirements are strict. All stations are equipped with Trillium 120PA seismometer (120 s-175 Hz) and Taurus digital collector. This data set is the waveform data from the first 100 s to the last 200 s of the direct P wave. Event magnitudes are greater than or equal to 5.0, and epicenter distances range from 30° to 90°. The data can be used to decipher the deep dynamic processes of the subduction-collision transition zone.
CHEN Ling
")
We compiled the Seismic Zonation Map of Western Asia using the ArcGIS platform through data collecting and digitization. The Seismic Zonation map of Western Asia covers Iran and its surrounding countries and regions. Based on the “Major active faults of Iran” map, the map is replenished with massive published data and depicts the location and nature of the seisogenic faults or active faults and the epicenter of earthquakes with M ≥ 5 from 1960 to 2019. The zonation map shows the mean values of peak ground acceleration (PGA) with 10% probability of being exceeded in 50 years. The two maps can not only be used in the research of active faults and seismic risks in Western Asia, but also will be applied to the seismic safety evaluation for infrastructure construction.
LIU Zhicheng

The Pan-Third Polar region has strong seismic activity, which is driven by the subduction and collision of the Indian plate, the Arab plate and the Eurasian plate. 3809 earthquakes with Magnitude 6 or larger have occurred in Pan-Third Polar region (north latitude 0-56 degrees and east longitude 43-139 degrees) since 1960. Among them, 59 earthquakes with Magnitude 8 or larger, 689 earthquakes with Magnitude 7.0-7.9 and 3061 earthquakes with Magnitude 6.0-6.9 have occurred. Earthquakes occurred mainly in the foothills of the India-Myanmar Mountains, the Himalaya Mountains, the Sulaiman Mountains, where the India Plate collided with the Eurasian plate, and the Zagros Mountains where the Arab plate collided with the Eurasian plate.
WANG Ji
")
We compiled the Seismotectonic Map and Seismic Hazard Zonation Map of Central Asia using the ArcGIS platform through data collecting and digitization. The seismotectonic map of Western Asia covers Kazakhstan, Uzbekistan, Kyrgyzstan, Tajikistan and Turkmenistan. The seismotectonic map is replenished with tremendous amount published data and depicts the location, character and name of the seismogenic faults or active faults and the epicenter of earthquakes with M ≥ 5 from 1960 to 2010. The zonation map shows the mean values of peak ground acceleration (PGA) with 10% probability of being exceeded in 50 years. The two maps can not only be used in the research of active faults and seismic risks in Central Asia, but also will be applied to the seismic safety evaluation for infrastructure construction.
LUO Hao
")
We use waveform cross-correlation to analyze the recordings of eight earthquakes (2009-2018) beneath the Indian Ocean at stations from the Chinese Digital Seismic Network. We obtain 929 high quality residual traveltime differences between the phases ScS and S (Differential traveltimes.dat). We interpret variations of δt up to 10 seconds as due to horizontal shear-velocity variations in D” beneath northern India, Nepal, and southwestern China. The shear velocity can vary by as much as 7% over distances shorter than 300 km. Our observations provide additional observational evidence that compositional heterogeneity and possibly melt contribute to the seismic structure of the lower mantle characterized by long-term subduction and mantle downwelling.
LI Guohui, BAI Ling

This data comes from the result of teleseismic data, mainly including the velocity and radial anisotropic structures beneath western Tibet. In the process of processing, bandwidth filtering is adopted, and the filtering range is 0.05-2 Hz. Due to the use of teleseismic data, the cross-correlation method is used in the acquisition process to "align" the waveform. The data quality is good, because the extracted data are all from the earthquakes with magnitude greater than 5.0 located in the global seismic catalog, and each event has an obvious take-off point. The data can be used by other seismologists to reconstruct and analyze the underground structures in this area.
ZHANG Heng
")
The researchers of the research group carried out field investigation on the typical "wide and gentle" gully debris flow gully - Wenchuan Qipan gully and "narrow and steep" gully debris flow gully - Beichuan Qinglin gully branch. Through the field particle screening test of typical channel deposits in qipangou, and the qualitative and quantitative description of channel shape and typical channel section, it is found that the wide and gentle channel material source has the characteristics of "wide gradation, weak consolidation and easy stratification"; In addition, the debris flow accumulation samples of Qinglin gully branch gully are selected for on-site particle screening test, and the clay content, porosity and shear strength of the test soil samples are determined.
ZHANG Youyi

Data content: this data set is the EBSD and TIMA analysis and test results and seismic wave calculation results of mylonitic amphibolite in the southeast edge of Tibet Plateau. The EBSD test results obtain the crystal orientation data (CPO) of amphibole, mica and plagioclase. The mineral composition of the whole rock and the corresponding percentage content are obtained from the TIMA test results.The seismic properties is based on EBSD and TIMA data calculated by ANIS_ctf software. Data source and processing method: EBSD analysis was completed by FEI FEG-650 scanning electron microscope equipped with EBSD probe in the Key Laboratory of orogenic belt and crustal evolution, School of earth and Space Sciences, Peking University. The accelerating voltage is 20kV and the working distance is 18 mm., In order to avoid the error caused by mineral particle size to the calculation of orientation difference density function (ODF), we manually collected the crystal orientation data (CPO) of main minerals amphibole, mica and plagioclase by using EBSD point analysis mode of hkl Aztec software. The data of TIMA comes from the Key Laboratory of orogenic belt and crustal evolution of the Ministry of education of Peking University and is obtained by four high spatial and temporal resolution EDAX energy spectrometers mounted on tescan field emission scanning electron microscope. The test voltage is 25kV, the working distance is 15mm, and the beam spot is 100nm. Description of data quality: the sample is a 27mm x 47mm standard sheet. EBSD test adopts manual point analysis mode, which avoids the error caused by mineral particle size to the calculation of orientation difference density function (ODF), and removes inaccurate identification points (MAD > 1.3 °), with high data quality and strong reliability. The TIMA scanning area is full film scanning, the scanning mode is high resolution, and the step size is set to 1 μ m。 Because four energy spectrum detectors are equipped, the data acquisition time is short, the accuracy is high, the requirements for sample morphology are low, the detection limit is low, the data quality is high and the reliability is strong. Data application achievements and prospects: through the analysis of EBSD and TIMA data, we have defined the mineral assemblage characteristics of the lower crust on the southeast Tibet Plateau, which can be used for the calculation of rock seismic wave attributes and the study of the deformation model of the lower crust on the southeast edge of the Qinghai Tibet Plateau.
HUANG Baoyou
")
The data is the near seismic waveform of nangabawa short period dense seismic array, which contains the original seismic waveform and the preprocessed seismic waveform. The original data are the seismic waveforms cut according to four near earthquake events (Ms 5.2 in Tangshan, Hebei, Ms 5.4 in Huocheng, Xinjiang, Ms 4.2 and Ms 4.0 in Bomi, Tibet). The waveform length is 120s before P wave and 1800s after P wave. Preprocessing includes re-cut the waveform (- 20-100s), band-pass filtering (the frequency band range used in Tangshan, Hebei and Huocheng, Xinjiang is 0.1-1hz, and Bomi, in Tibet is 0.1-2hz), rtrend, rmean, and the ZNE component is rotated to the ZRT component. The quality of the data is good.The fine structure of underground lithosphere can be analyzed by near earthquake waveform.
SHEN Xuzhang

The global seismic waveform data of magnitude 7 or above recorded by 10 seismic stations in the Himalaya region (from January 1, 2020 to December 31, 2020), including the name and location of stations, and the clear seismic waveform of each event filtered by the seismic event directory (the seismic directory is from USGS) to 10 stations. The waveform data is clipped to 100s before and 300s after the arrival of P wave, and the format is sac format. The header contains station information, event information, azimuth and other information. It is named in the form of "network. Station name. Channel. Component. D. year. Julian day - time. 000000. Event".
BAI Ling
")
The reconstruction of the craton by the mantle plume and its subsequent dynamic effects are important scientific issues related to the formation and evolution of the craton. Emeishan Large Igneous Province is located in the western margin of Yangtze craton, which is an ideal window to study the effect of mantle plume on craton reformation. With the support of the national key research and development program "Deep Process and Resource Effect of Important Yanshanian Events" (Grant 2016YFC0600400), the mantle deformation characteristics of Emeishan Large Igneous Province were obtained by using teleseismic shear wave (sks, SKKS and PKS) splitting; Combined with the wave velocity structure, geothermal flow and volcanic rock distribution, it reveals the strengthening effect of mantle plume on the craton and the profound influence of the strengthened lithosphere on the present deep process of the southeastern margin of the Qinghai Tibet Plateau; At the same time, it also provides a new perspective for further understanding the origin of seismic anisotropy at the top of the upper mantle and asthenosphere demonstrator interaction.
LI Wei CHEN Yun
")
The data include the location information of 255 seismic stations in Qinghai Tibet Plateau, North China Craton and South China block junction area, teleseismic receiver function waveform, HK result and crustal S-wave velocity inversion using receiver function (Gauss coefficient is 2.0) and surface wave. Based on the data of 30-90 degree epicentral distance and more than 5.5 earthquake events recorded by 146 fixed stations set up by China Seismological Bureau for 2 years and 109 mobile stations set up by Institute of Geology and Geophysics of Chinese Academy of Sciences for 12-18 months, the time domain iterative deconvolution method of CPS program is used to extract the radial convergence function. The results show that: the crust structure of the typical craton is still preserved in the core area of Ordos and Sichuan Basin, and the low velocity layer of the central crust of the East-West collision subduction of the North China Craton in the south of Ordos is not preserved. The lower crust of Sichuan basin may have been embedded into the crust of Qinghai Tibet Plateau along the Longmen Mountain; The West Qinling and the boundary area of Qinling Dabie orogenic belt have thick crust, low wave velocity ratio and high S-wave velocity structure. The uploaded data provide valuable data and information for others to further study the structural characteristics of the northeastern margin of the Qinghai Tibet Plateau and its adjacent areas.

The data set is mainly shown in the article https://doi.org/10.1016/j.pepi.2020.106617. The S-wave velocity structure under the station is obtained by using the joint inversion of the P-wave receiver function and the group velocity dispersion of 42 stations located near the Dahutang mining area in Jiangxi Province. The dataset contains 42 files in the format of DAT: for example, dahutang.jx46.velocity.dat. The data set represents the lithospheric velocity structure of the Dahutang mining area and understands the deep mechanism of Dahutang polymetallic mineralization.
DENG Yangfan

The data set is mainly shown in the article https://doi.org/10.1016/j.pepi.2020.106617, which includes the distribution of the average thickness of the crust and the average Vp/Vs ratio of the crust based on the h-kappa stacking of the P-wave receiver functions on 42 stations near the Dahutang mining area in Jiangxi Province. The dataset contains 1 file in DAT format: Dahutang_ moho_ vpvs.dat。 The data set can be used to show the Moho undulation feature of the Dahutang mining area, perspective the transverse distribution characteristics of crust and crustal wave velocity ratio in Dahutang polymetallic metallogenic area, and then discuss the difference of average composition of crust inside and outside the mining area.
DENG Yangfan
Contact Support
Links
National Tibetan Plateau Data CenterFollow Us

A Big Earth Data Platform for Three Poles © 2018-2020 No.05000491 | All Rights Reserved
|  No.11010502040845
Tech Support: westdc.cn